
Statistical Process Control (SPC)
Move towards prevention-based quality control. Measure, monitor, and improve process capability with data-driven insights.
Scientific Process Monitoring
Statistical Process Control (SPC) employs statistical methods to measure and eliminate special cause variation. It shifts the focus from detection-based to prevention-based quality control. By monitoring SPC charts, organizations can predict process behavior and take proactive measures.

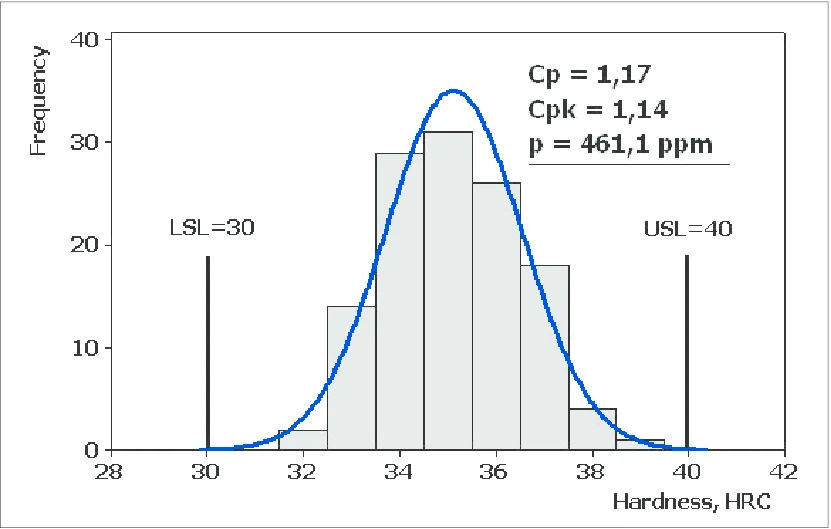
Process Capability (Cp, Cpk)
Process capability assesses the ability of a process to meet specifications. Potential capability (Cp) and actual capability (Cpk) are key estimates. They reflect the nonconformance rate by expressing performance as a single number, typically a ratio of specification limits to process spread. These metrics are invaluable for evaluating both initial and ongoing capability.
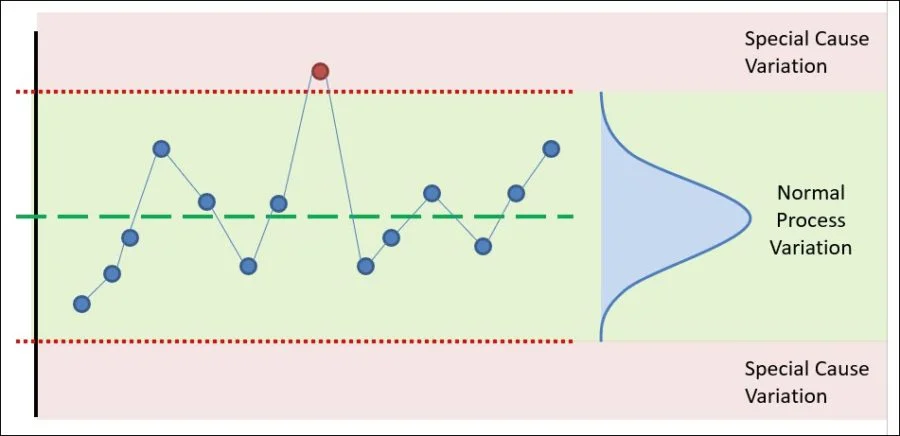
Process Variation
A stable process displays common cause variation—variation inherent to the process. If a process is unstable, it shows special cause variation from external, non-random factors. SPC helps distinguish between the two, allowing you to stabilize processes and predict future performance within defined limits.
Interactive Data Visualization
Leverage tools like Power BI to deliver insights throughout your organization. Connect disparate data sources, simplify preparation, and drive ad hoc analysis. Create personalized dashboards for a 360-degree view of your business, scaling enterprise-wide with built-in governance and security. This enables everyone to consume beautiful reports on web and mobile devices.
Ready to Improve Your Process Capability?
Contact our experts to implement statistical process control in your laboratory today.
Contact Us